Snapshot
At ByteDance, many internal workflows run through tools we build ourselves. If an employee needs to file an IT ticket, reserve a seat in a new office, borrow a laptop, join guest Wi-Fi, or request access to an internal service, there is usually a dedicated product or interface behind that action.
That creates an interesting product challenge: these tools support high-volume, operationally important workflows, but they often compete with the mental model users bring from mature third-party systems like ServiceNow or other enterprise platforms they used before joining ByteDance. As our internal products grew, so did the feedback.
So I built an app to analyze user feedback, generate a dashboard, and generate insights for the Product Operations team to share with cross-functional partners.
Self-serve voice-of-customer reporting for internal products with source links and review flags.
Typer CLI, SQLite, Pydantic, YAML taxonomies, Lark APIs, LLM enrichment, and static dashboards.
Turn scattered feedback into product signal without replacing human judgment.
The Problem
Feedback for a single internal product rarely lived in one place. A product might have three or four Lark channels, with additional channels for launch periods, UAT, regional teams, or China-specific workflows.
For a while, the Ops team could keep up manually: reading through threads, making notes, grouping issues by theme, and creating summaries for PMs and business stakeholders. It worked when volume was low.
It stopped working as the products matured and we had departures in the team. The process could not scale, and the Ops team started to become a bottleneck for decision-making and roadmapping.
What I Built
I built a Python-based tool that ingests feedback from Lark groups, classifies each feedback item with LLM assistance, and exports a reusable static dashboard with charts, summaries, source links, and review flags for each product I supported.
- Ingest
- Assemble
- Enrich
- Classify
- Export
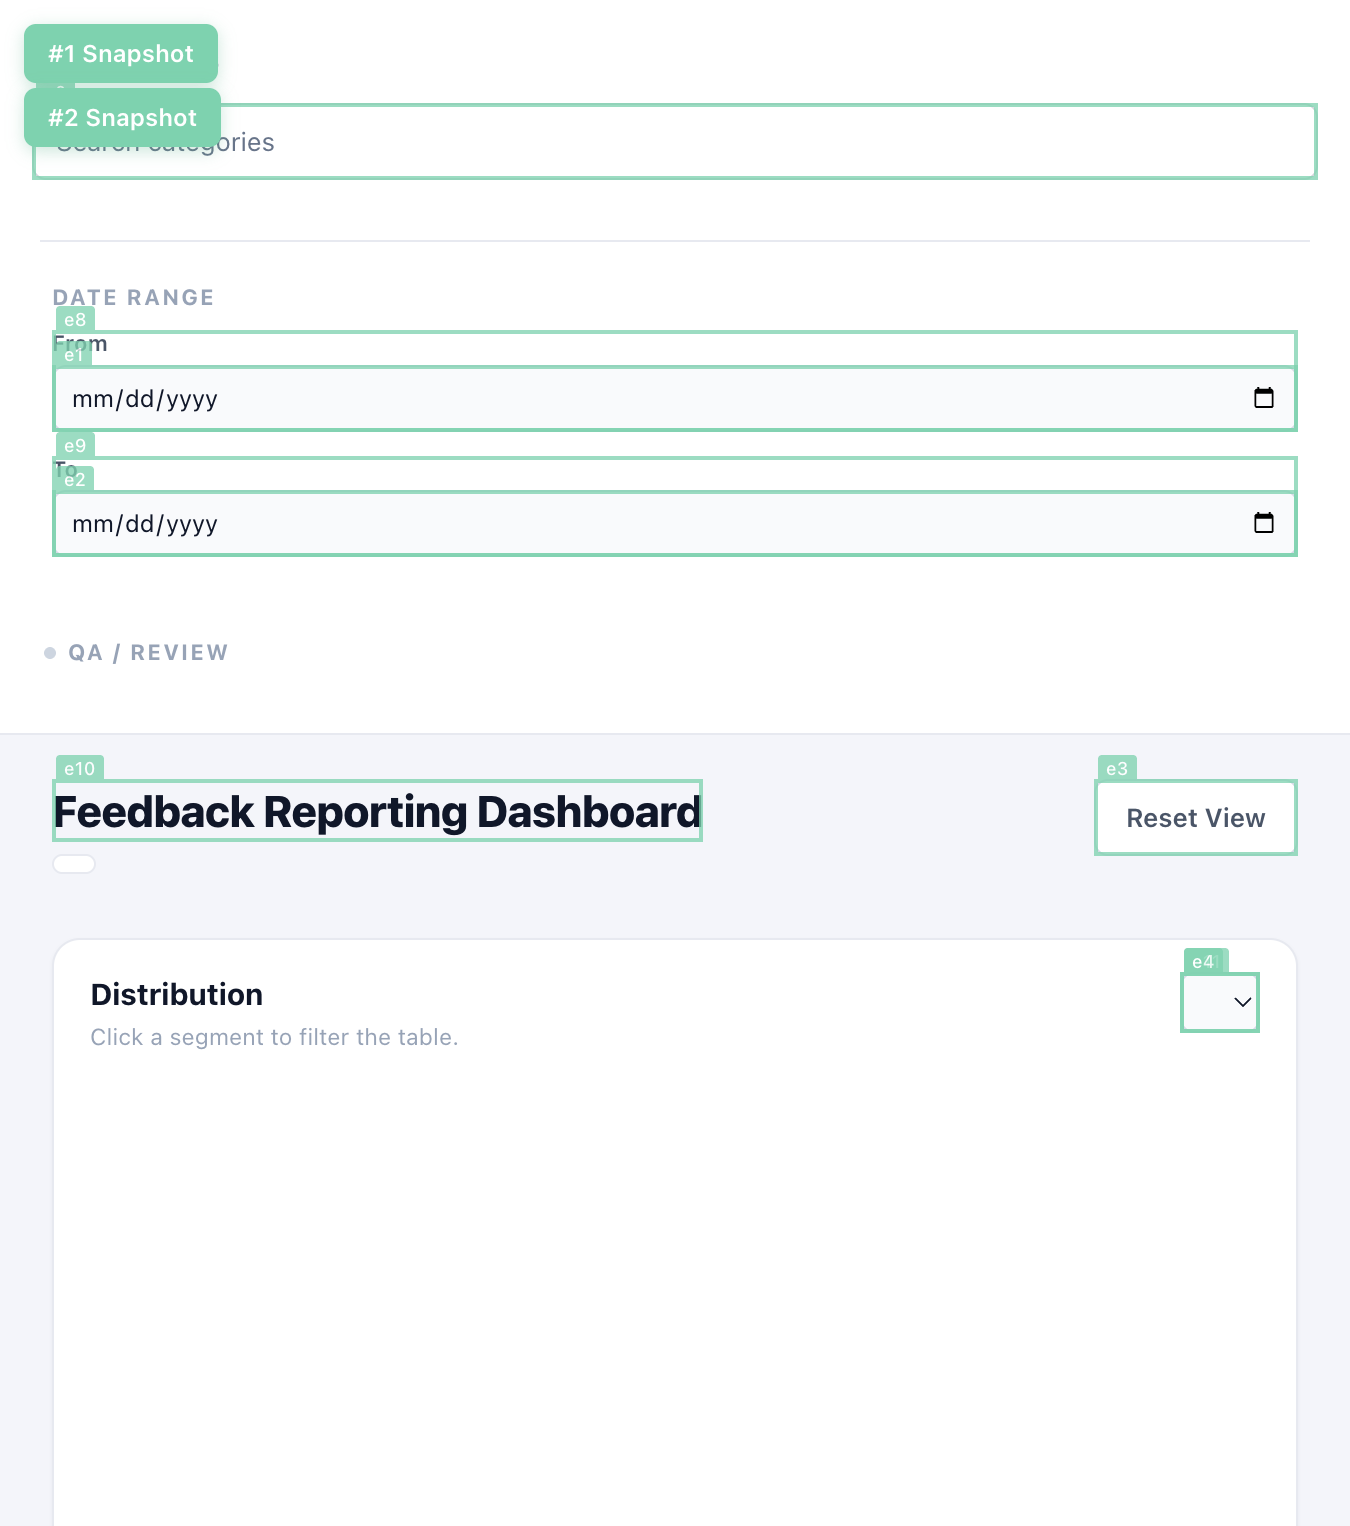
The dashboard gives Product Ops, PMs, and stakeholders a shared view of what users are saying. It also gives Product Ops a starting point for deeper research: instead of beginning with a blank page, the team can start with clustered themes, low-confidence items, unresolved issues, and links back to the original evidence.
Product Decisions
Make it generic
The Ops team provides where to scrape feedback from and what the categorization expectation should be, whether that is a prompt, taxonomy, or stricter JSON schema.
Output a dashboard
A document is good for a narrative update, but a dashboard is better for review, filtering, scanning, and self-serve consumption by PMs and stakeholders.
Keep it read-only
The tool's job is to organize evidence, not intervene in the workflow. It does not post back into Lark, open tickets, or mutate source conversations.
Design for review
Confidence scores, strict JSON schemas, retry paths, and clear failures make the dashboard auditable instead of pretending the model is always right.
I also added a prompt and eval specifically for creating a "topic" of feedback, which could be one message, several messages, or a loose conversation that needs interpretation. Metadata like team member roles, bot IDs, and emoji etiquette helps the classifier understand whether a thread is unresolved, resolved, or still contested.
All saved summaries, taxonomy labels, and dashboard text are bilingual in English and Chinese so the dashboard can support multilingual teams without losing the original source text.
Engineering Approach
I built it as a Python CLI first because the goal was not to launch a full platform. The goal was to prove that user feedback from Lark groups could become a reliable weekly dashboard quickly enough to support Product Ops work.
The system stores structured data locally, applies schema-based LLM calls through a small client wrapper, and keeps model-generated outputs deterministic where possible. The source tree is organized by workflow stage: ingest, assembly, enrichment, categories, sorting, dashboard export, storage, and commands.
- Product-scoped runtime state under product, data, and dashboard bundle paths.
- SQLite migrations for evidence, enrichment, taxonomy, dashboard, and historical analytics schemas.
- YAML taxonomies with validation and lifecycle commands before classification.
- Pydantic dashboard contracts that make static export fail closed when required data is missing.
- Atomic dashboard bundle writes with both external JSON and inline bootstrap modes.
The Enrichment Layer
Many feedback items are multilingual. The system keeps original text intact while saving bilingual reporting fields for dashboard consumption. Screenshots often carry the most useful evidence, so the tool processes images with a vision model and stores extracted text plus a short description.
User reactions also carry signal. A DONE or CheckMark reaction from a team
member can be evidence that an issue was resolved, while disagreement reactions can show that the user
pushed back on a proposed answer. Preserving those reaction keys helped the classifier reason about status
and urgency.
Taxonomy as Product Strategy
The taxonomy layer is one of the strongest PM parts of the system. A dashboard is only useful if its categories match how the product team thinks.
The first version supported product-specific category trees, but later work introduced a more flexible taxonomy model for products where feedback needed multiple independent dimensions rather than a single hierarchy. This matters because not every internal product organizes feedback the same way.
Dashboard Output
The dashboard is static by design. It can be generated locally and shared as an HTML/JSON bundle without standing up a hosted web app. That kept the workflow lightweight while still giving stakeholders a polished interface.
- Product metadata and active taxonomy information.
- Category and dimension aggregates.
- Daily, weekly, monthly, quarterly, month-over-month, quarter-over-quarter, and year-over-year series.
- Reconciliation checks for item counts and classification coverage.
- Source links, evidence payloads, low-confidence visibility, and item-level summaries.
Quality and Trust
Trust came from several layers working together: source fidelity, original preservation, strict contracts, failure visibility, product scoping, bilingual output, and historical analytics. This is the difference between "AI summarized some feedback" and "the team has an auditable feedback reporting layer."
Outcome
The result is a self-serve VOC dashboard that reduces manual analysis time by roughly 80 percent while preserving the evidence Product Ops needs to trust the output. Through prompt iteration and human-in-the-loop review, the classification workflow has reached 95 percent+ accuracy for feedback triage across all products.
More importantly, the tool changed the starting point for product conversations. Instead of asking the Ops team to synthesize scattered feedback, the PM team can self-serve. Every time a PM or stakeholder needs an update, the dashboard makes themes, unresolved items, source threads, and review-needed cases visible in one place.
That shifted Product Ops from being the bottleneck for basic reporting to being a higher-leverage partner in deciding what deserved deeper research.
What I Learned
This project reinforced that automation is most useful when it respects the messy shape of real work. The hard part was not just calling an LLM and asking it to classify text. The hard part was preserving source context, separating user feedback from team discussion, handling multilingual inputs, reading screenshots, interpreting reactions, and giving humans a clear way to review uncertain results.
I also learned that the right first version is often narrower than the full idea. By focusing on topic groups, static dashboard output, strict schemas, and manual runs, I could build something useful without turning the project into a full hosted platform too early.
The broader lesson was that good internal tooling does not need to replace human judgment. It should remove the repetitive work around human judgment so teams can spend more time understanding users and less time copying, grouping, and re-summarizing feedback.
Next Things to Explore
- Reduce token usage without weakening context quality.
- Add more parallelism in the LLM pipeline to improve speed and throughput.
-
Strengthen the
AGENTS.mdoperating rules: one failure should not derail the whole process, retries should be built in, low-confidence items should retry with stronger models by default, and CLI output should follow clear operator etiquette.
Interview Version
I built an automated feedback analyzer for internal ByteDance products because Product Ops was managing feedback across multiple Lark channels, regions, launches, and product lines. The manual process worked when volume was low, but as usage grew it became slow, inconsistent, and dependent on Product Ops reading every thread before PMs could understand what was happening.
I designed a Python CLI that ingests Lark topic-group feedback, preserves the original source threads, enriches messages with translation and screenshot understanding, and uses LLM-assisted classification to assign category, type, status, summary, confidence, and review flags. The output is a static dashboard that gives PMs and stakeholders a self-serve view of feedback themes, unresolved issues, and items that need Product Ops review.
The workflow reached 95 percent+ classification accuracy for feedback triage, reduced manual analysis time by roughly 80 percent, and made VOC reporting more scalable across internal products.
Resume Version
Engineered LLM-assisted feedback classification workflows for internal ByteDance products, combining Lark topic-group ingestion, multilingual enrichment, screenshot parsing, strict JSON schemas, and human-in-the-loop review to achieve 95 percent+ triage accuracy, reduce manual analysis time by 80 percent, and scale self-serve VOC dashboards for PMs and Product Ops stakeholders.